
The five case studies below document real analyses of photovoltaic plants. What they have in common: in all of them, conventional monitoring systems showed nothing unusual. The performance ratio sat in a range considered “normal" in every case. Only the comparison against a plant-specific, physically modelled target value made the real losses visible.
Case 1 · Flevoland (NL) — 55 MWp
Problem: High DC/AC ratio of 1.40 (40% oversizing). Above 800 W/m² irradiance the inverters ran systematically at their power limit – substantial clipping. Finding: 1,379,605 kWh, or 7.69% below target production – depending on the electricity price, €110,000 (€0.08/kWh) to €300,000 (€0.22/kWh) of lost yield per year. Recommendation: a battery storage system to absorb the clipped energy delivered the highest ROI; alternatively additional inverter capacity.
Case 2 · Friesland (NL) — 103 MWp
Problem: An incorrectly set MPP voltage window on the central inverters – identifiable purely from the distribution of AC power over irradiance and module temperature, since the DC values were not available via the monitoring interface. No inverter reported a fault. Finding: a performance ratio of 66.30% instead of the achievable 74.24% – 10.70% technical shortfall in the quarter, around 3.57 GWh of loss in three months. Fix: correcting a single parameter, no hardware replacement – €0 in material costs.
Case 3 · Jutland (DK) — 74 MWp
Problem: A structural design flaw left almost half of the generation running outside tolerance, while monitoring reported no fault for years – the plant counted as available and trouble-free. Finding: only the target/actual comparison at 15-minute resolution exposed the error. Measure: +4.4% additional yield per year; a twelve-month test series proved the effect before the investment decision, and the measure paid for itself in about six months.
Case 4 · Aquitaine (FR) — 23 MWp
Problem: The most striking example of the limits of conventional monitoring – the irradiance and production curves ran cleanly in parallel, no error message, no alarm. Finding: on three documented days in June, 23.3% (69,098 kWh) were missing against the weather-based target; the loss set in above roughly 1,050 W/m². Cause: defective inverter cooling fans – confirmed and fixed at routine maintenance about a year later; on the order of ~€170,000 per year.
Case 5 · Italy — ~1 MWp
Problem: The plant underperformed for years – yet conventional monitoring showed nothing. The target/actual comparison revealed a clear pattern: a dip at midday under peak irradiance and a poor start into the morning. Two causes worked together: the modules failed to reach their datasheet values under midday heat (an independent module test confirmed the shortfall – the temperature coefficients did not hold up in practice), and the master-slave inverters were poorly tuned to the situation: the handover between master and slave was mistimed, on top of an incorrectly set input/MPP voltage window.
Finding: around 338,815 kWh of lost yield per year (of which ~121,550 kWh inverter losses) – at a €0.12/kWh feed-in tariff, ~€40,658 per year. With 17 years of remaining term, that adds up to several hundred thousand euros.
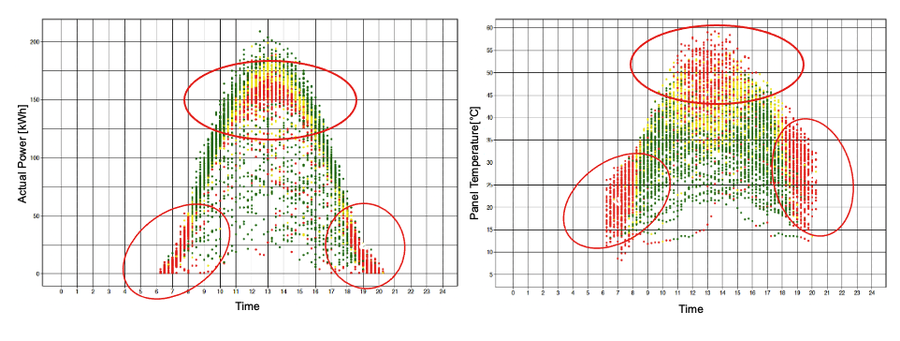
Measure: the MPP/input voltage window on the central inverter was lowered by ~5% and the master-slave handover corrected in software. Effect: the inverter starts earlier in the morning and runs longer in the evening – real annual yield rises, even though the (anyway unreachable) midday peaks are given up. Fix: €250.
What good are the MPP peaks if the module can't deliver them?
At a glance
| Site | Capacity | Main issue | Key finding |
|---|---|---|---|
| Flevoland (NL) | 55 MWp | Clipping (DC/AC 1.40) | 7.69% · ~€110,000/year |
| Friesland (NL) | 103 MWp | MPP voltage window | 10.70% · 3.57 GWh in 3 months |
| Jutland (DK) | 74 MWp | Design flaw | +4.4% p.a. · ~6-month payback |
| Aquitaine (FR) | 23 MWp | Defective inverter fans | 23.3% on 3 days · ~€170,000/year |
| Italy | ~1 MWp | Module underperformance + inverter master-slave | 338,815 kWh/year · €250 fix |
| Total | ~256 MWp | 5 plants | hidden losses in the millions |
The shared insight
All five cases share one denominator: conventional monitoring would not have caught the losses. The problems were technically different – clipping, an MPP voltage window, a design flaw, defective fans, module underperformance – but economically just as severe. Only the comparison against a dynamic, plant-specific target turns “running quietly" into a reliable “running optimally".
See what no monitoring shows.